New York City produces more than 14 million tons of waste every year and while there are ongoing attempts to streamline its waste management, as seen with the introduction of the Commercial Waste Zones bill, the city as a whole is still heading in the wrong direction.
Below is a compilation of the most important NYC waste statistics – both commercial and residential – to give an overview of how the city currently stands from a waste-management perspective.
 NYC Food Waste Statistics
In 2017, restaurants and caterers accounted for 20% of all food waste in the city, while 54% came from residential settings. The remaining 26% of food waste was split between other commercial entities and institutions such as health care facilities, colleges, universities, grocers & markets, event facilities and food manufacturing and processing (7%). This equates to each household in NYC wasting an average of 8.4 pounds of food per week.
The Natural Resources Defense Council (NRDC) assessment that produced these statistics in 2017 also published a list of the top foods wasted by type in NYC, keeping in mind that some food types appear due to their high proportion of inedible components (e.g., banana skins):
1. Coffee (including liquid coffee and grounds)
2. Banana
3. Chicken
4. Orange
5. Apple
6. Potato
7. Bread
8.Soup
9. Milk
10. Rice
That said, an estimated 68% of all food waste in NYC was considered edible and even inedible food waste (e.g., banana skins) has a negative impact when sent to landfill rather than compost since they break down slower, produce methane and co2, potentially contaminate groundwater, and attract pests. In 2017, the average proportion of total discarded food that was sent to compost and animal feed was 38% in New York City.
Other biodegradable waste includes garden waste as well as soiled paper and card stock, which combined is sometimes referred to as “organic waste.” A 2021 report found that 6.6 tons of organics recycling were diverted each day from curbside and containerized collections in NYC. However, this comes at a price, with a 2019 study finding that collecting and processing organic waste in NYC cost $734 per ton – considerably higher than regular refuse ($216) or recycling ($206).
 NYC Waste Recycling Statistics
According to the New York City Municipal Refuse and Recycling Statistics: Fiscal Year 2021 annual report, there were 1110.3 tons of Metal/Glass/Plastic (MGP) Recycling diverted per day from curbside and containerized collections throughout the year. This represents a residential recycling rate of 17.6%, lower than the 18.5% of the year before and considerably worse than comparable cities on the West Coast.
The New York City Housing Authority recycles at a rate of just 1.5%, which according to 52% of respondents to a survey on the topic was due to the need for “more containers and in more convenient locations”. Furthermore, due to the placement of the NYCHA’s 1,938 recycling bins, there is a high incidence of contamination – similar to that of outdoor recycling bins in public areas, according to NYCHA Waste Management (2019).
As of 2017, the overall contamination of MGP recycling had dropped to 19.5% from 26.6% in 2013, which may in part be due to the expansion of MGP recycling to include all rigid plastics.
NYC Paper and Card Stock Waste Statistics
As of 2017, the residential capture rate for paper and cardboard into the recycling stream was 51.3%, up from 46.8% in 2013 and 45.8% in 2005. However, 8.9% of the paper recycling was contaminated, up from 5.1% in 2005.
According to the New York City Municipal Refuse and Recycling Statistics: Fiscal Year 2021 annual report, 1087.3 tons per day of Paper/Cardboard Recycling was diverted from curbside and containerized collections.
NYC Aluminum and Other Metal Waste Statistics
In 2017, metal made up 4.6% of the overall residential waste stream. However, only 30% of aluminum cans collected by the NYC Department of Sanitation (DSNY) were captured in the MGP stream, the rest being in general refuse.
This low rate has been attributed to cans being taken out of recycling bins, where they are easily identifiable, but not trash cans so that the 5-cent deposit can be claimed. This is somewhat reflected in the 229.9 tons of redeemed bottles and cans that were diverted each day in 2021.
Aluminum foil and containers had an even lower capture rate than cans of just 15%, which is possibly due to the food contamination inherent to these materials.
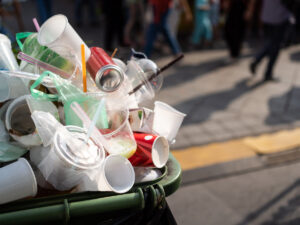
NYC Plastic Waste Statistics
As of 2017, the amount of non-bottle rigid plastics captured in the recycling stream was 27.5%, an increase from 16.4% in 2013. For rigid plastic bottles and jugs, the capture rate was 50%, down from 50.6% in 2013.
Plastic film such as supermarket bags make up 7.5% of NYC’s waste stream and are extremely challenging to recycle as they tend to clog up machines and being the whole recycling process to a stop. A reason for the high rate could be their use as carriers of other refuse.
NYC Glass Waste Statistics
Glass accounted for just 4% of discard in 2017, with a capture rate of 63% — an increase from the previous report in 2013.
NYC Clothing Waste Statistics
Clothing and textiles make up 5.7% of NYC’s waste and include everything from clothes to shoes to carpets. In 2017, this equated to the average household discarding 120 pounds of textiles every year.
In 2021, there were around 4.9 tons of textile waste collected from apartment buildings, non-profits, and businesses, and recycled through “Re-fashioNYC”, each day. This was along with 33.2 tons of textile donations.
NYC Construction Waste Statistics
Reports from 2016 indicate that New York City was processing an average of 7,500 tons of Construction and Demolition (C&D) waste each day. The exact amount of C&D waste in NYC is hard to calculate due to the low reporting, but a 2003 report by the City of New York Department of Design and Construction revealed that C&D accounted for more than 60% of the solid waste stream in the city – considerably higher than elsewhere in the country. However, this will very likely have changed over the past two decades.
C&D waste is considered commercial waste, however, if it is generated from DIY projects, it can be disposed of via the DSNY Refuse collections. This residential C&D waste made up 4.5% of overall waste in 2017, down from 5.1% in 2013.
NYC E-Waste Statistics
In 2021, NYC diverted 2.2 tons per day of electronic waste collected through “E-CycleNYC”. There was a further 24.4 tons of “electronics recycling” and 0.1 tons of rechargeable battery recycling.
The amount of e-waste as a proportion of total residential waste dropped between 2013 and 2017, from 0.89% to 0.34%. This is potentially due to the banning of e-waste disposal in DSNY Refuse collections in 2015.
What NYC Waste Statistics Can Tell Us
Generally speaking, the amount of waste produced in New York City is too high and the rate of recycling too low. There may be some changes with the introduction of the new Commercial Waste Zones bill, but the residential waste streams are still not in line with other comparable cities.
If you want to learn more about responsible waste disposal and how your business can begin increasing diversion rates, then contact our TRUE advisors today to discuss your requirements and learn more about how to develop a healthier relationship with waste by subscribing to the RTS blog.
[mosaic_button url=”https://www.rts.com/contact” link-text=”Contact us today.”]